New CDC Data: Four Chronic Conditions Represented at 48% of U.S. Residential Care Communities

New national findings reveal how often dementia, heart disease, diabetes and depression are represented across residents in assisted-living and other residential care communities.

Nearly half of U.S. residential care communities (48.0%) reported having at least one resident diagnosed with each of four selected chronic conditions in 2025, according to a new report from the Centers for Disease Control and Prevention’s National Center for Health Statistics (NCHS), released October 15, 2026. The conditions were Alzheimer disease or other dementias, heart disease, diabetes and depression.

The statistic describes conditions represented across a community’s residents, not the percentage of residents who had all four diagnoses and not evidence that any one resident had all four. The findings provide a national snapshot for families, caregivers, care providers and journalists examining the needs of an aging population.

Key Findings

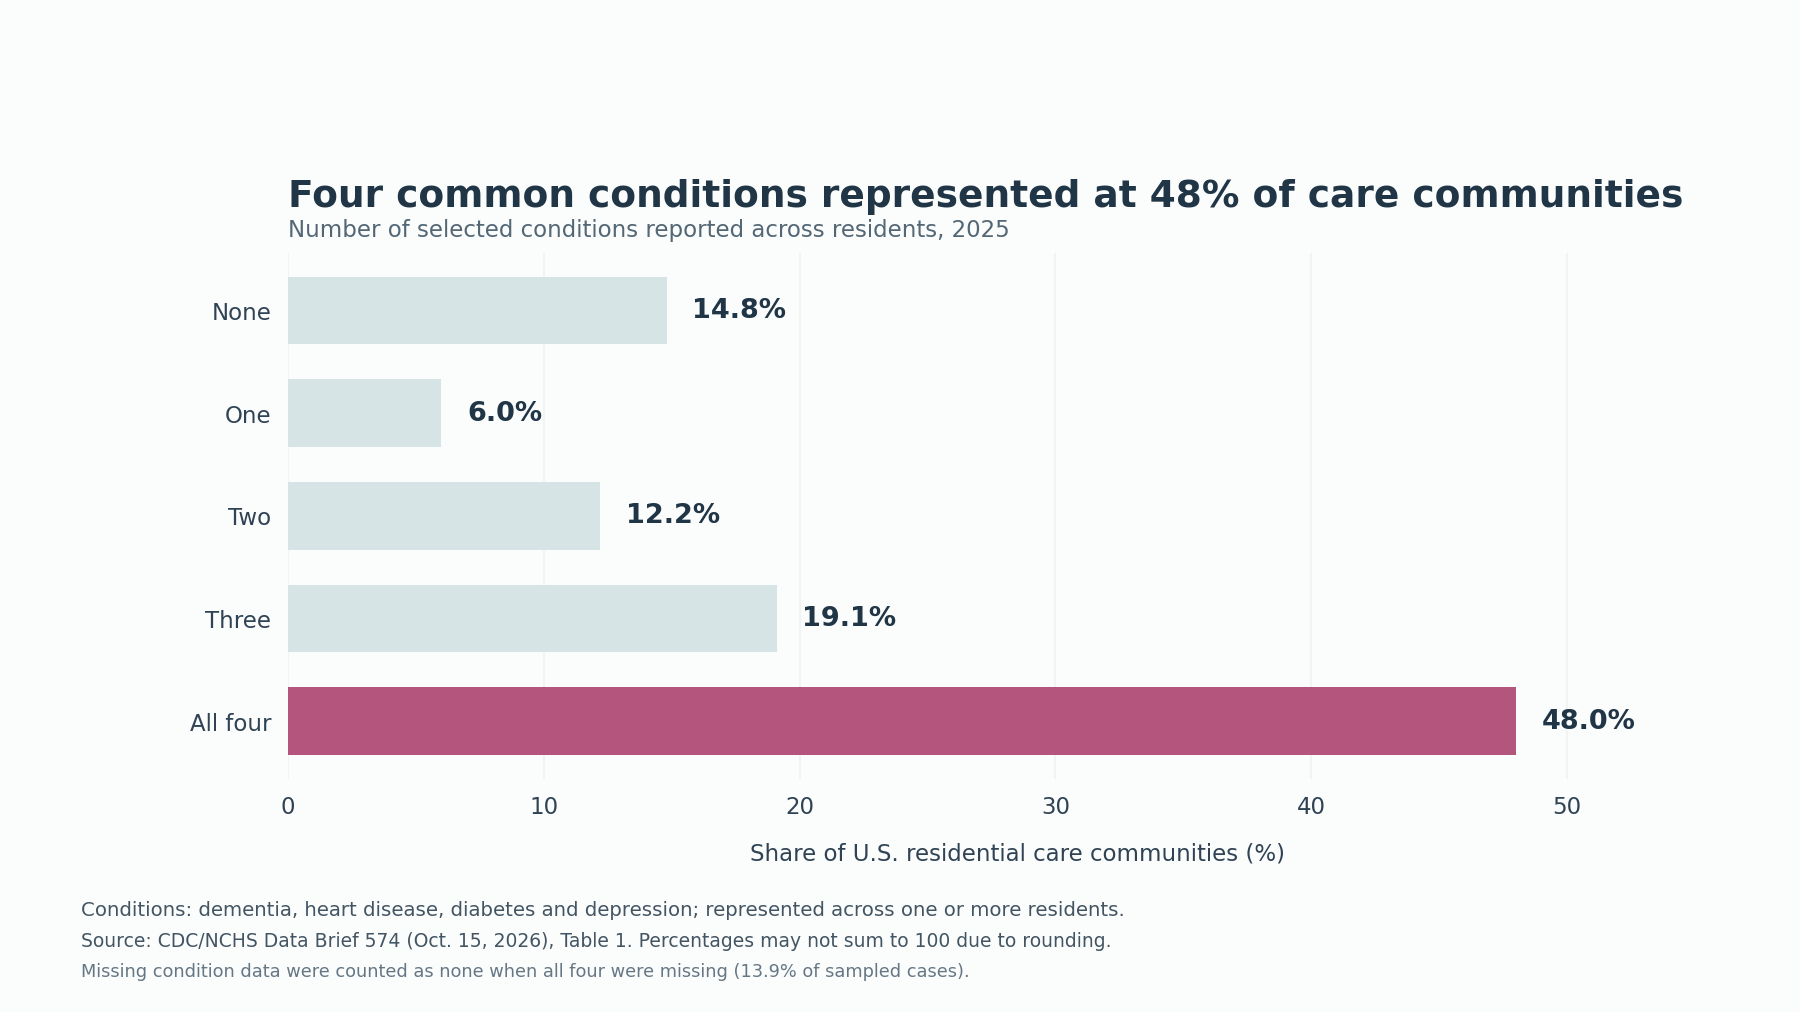
  • 48.0% of residential care communities reported all four selected conditions represented across one or more current residents.
  • 14.8% reported none, 6.0% reported one, 12.2% reported two and 19.1% reported three of the selected conditions represented.
  • 62.4% of nonmetropolitan communities reported all four conditions represented, compared with 45.4% of metropolitan communities.
  • 54.3% of nonprofit communities reported all four conditions represented, compared with 46.8% of for-profit communities.
  • Among communities reporting a resident fall in the previous 90 days, 66.3% had all four conditions represented, compared with 31.0% among communities without a reported fall.
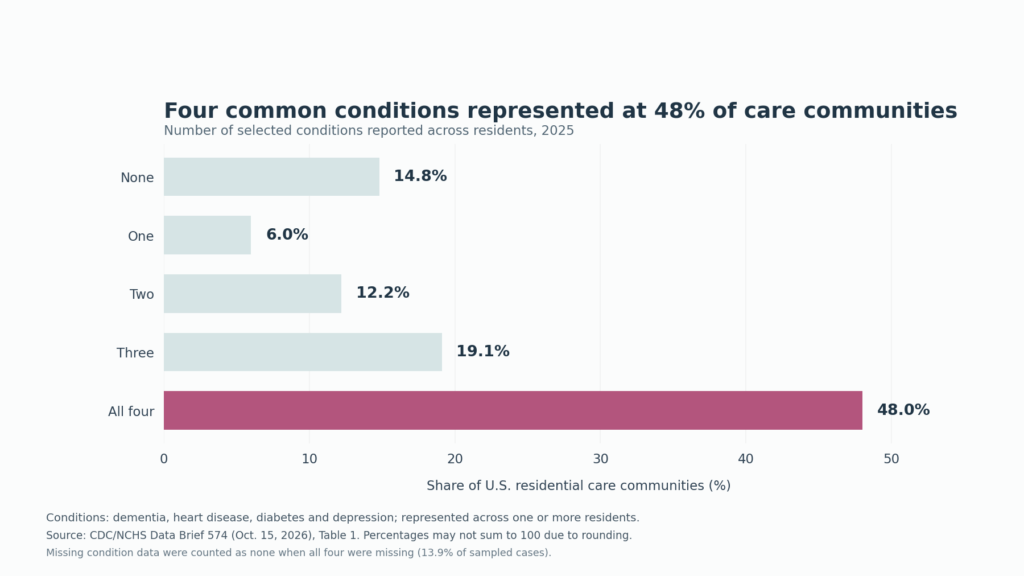
Source: National Center for Health Statistics, National Post-acute and Long-term Care Study, 2025; NCHS Data Brief No. 574, published October 15, 2026. Percentages may not total 100 due to rounding.

What the 48% Finding Actually Means

The NCHS measure counts how many of four specified conditions were reported among any current residents of a residential care community. For example, one resident might have diabetes while another has depression and a third has dementia. A community could therefore have all four conditions represented without any individual having all four. The report estimates that approximately 15,100 communities met this definition in 2025.

That distinction matters for headlines and care decisions. The report does not estimate how many individual residents have multiple conditions or how severe those conditions are. It also does not compare the quality of care at different facilities.

Geography and Community Size Showed Differences

All four conditions were represented at a higher percentage of nonmetropolitan communities (62.4%) than metropolitan communities (45.4%). By region, the corresponding percentages were 64.4% in the Northeast, 57.9% in the Midwest, 44.5% in the South and 41.4% in the West.

Community size also mattered in the descriptive data. Among communities with 4–10 beds, 31.5% reported all four conditions represented, compared with 56.9% for those with 11–25 beds, 65.2% for those with 26–50 beds and 59.0% for those with more than 50 beds. Larger communities may have more opportunities for all four diagnoses to be represented simply because they serve more residents; these figures do not prove why the differences occur.
What Families Can Ask When Evaluating Care

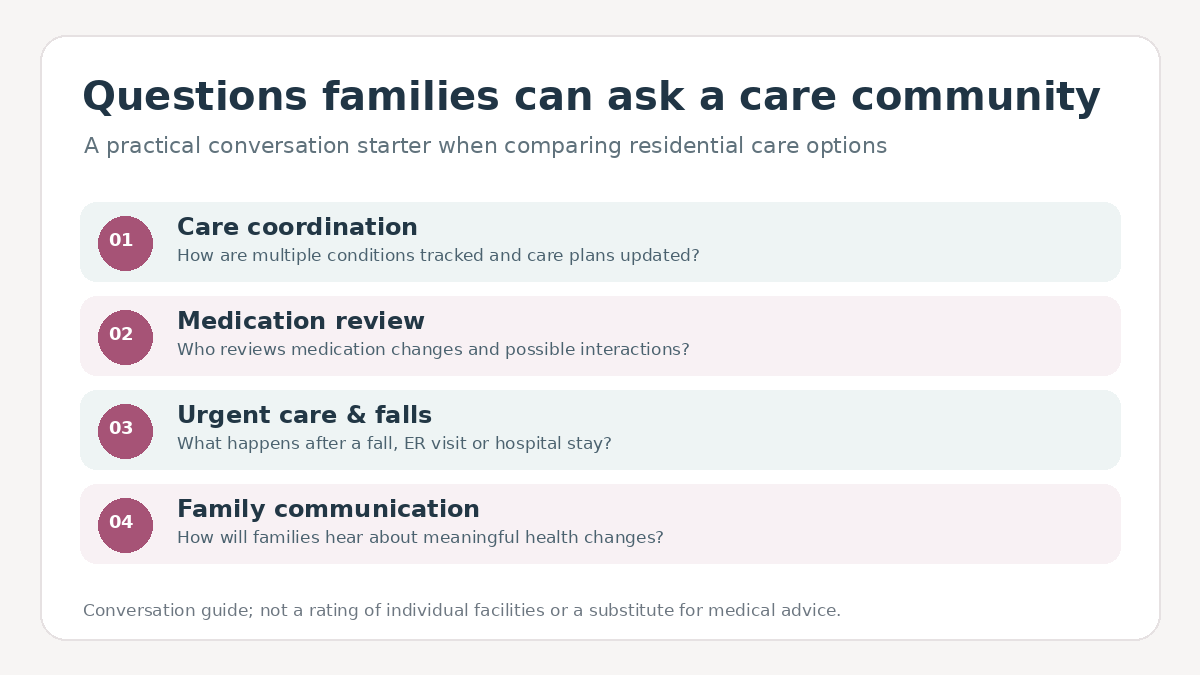
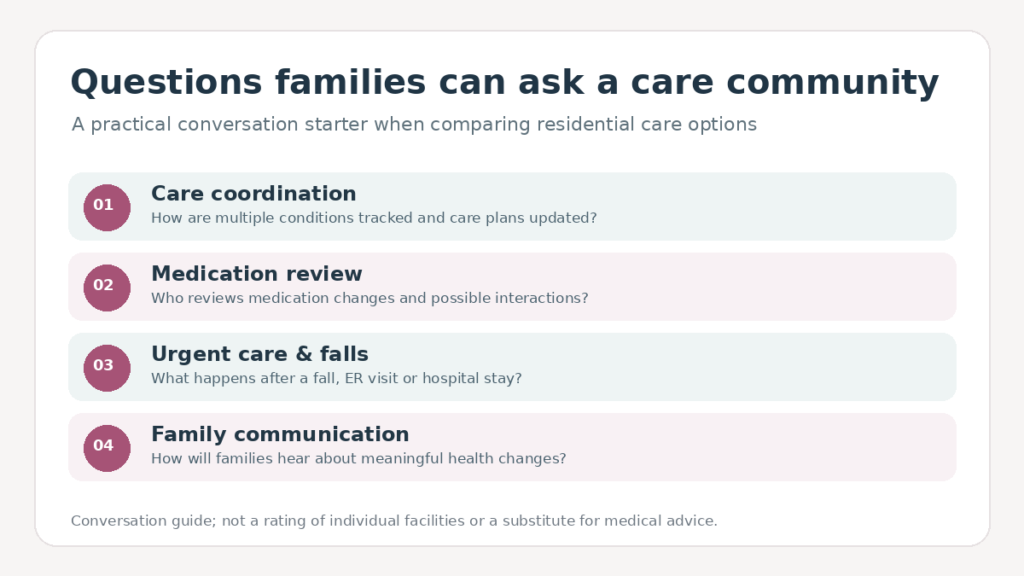
For women and families coordinating care for aging relatives, the findings offer a useful starting point for conversations rather than a scorecard for choosing a facility. Practical questions include how staff coordinate care across different diagnoses, who reviews medications, how falls and hospital visits are handled, and how families receive updates when health needs change.

Those questions are general considerations, not recommendations drawn from a trial of care interventions. The NCHS analysis did not test whether a specific staffing model, medication process or family communication practice improves outcomes.

Falls and Hospital Visits Were Associated With More Conditions Being Represented

Communities that reported a resident fall in the previous 90 days were more likely to report all four conditions represented than communities without a reported fall (66.3% versus 31.0%). The pattern was also present for communities reporting emergency department visits (62.0% versus 33.9%) and overnight hospital stays (63.4% versus 40.7%).

These are community-level associations. They do not show that the four conditions caused falls or hospital visits, nor do they establish the risk of any one resident experiencing an adverse event.

About the Data

The analysis is based on the residential care community survey component of the 2025 National Post-acute and Long-term Care Study (NPALS), a nationally representative survey of eligible U.S. residential care communities. Eligible communities were state regulated, had at least four licensed or certified beds, served predominantly adults, provided room and board with at least two meals daily, offered around-the-clock on-site supervision and help with personal or health-related care, and had at least one current resident. NCHS estimated approximately 31,400 such communities serving roughly one million residents on a given day in 2025.

The data are reported by communities, not collected as individual medical records for every resident. The four-condition measure counts whether each selected diagnosis was represented among one or more current residents. Missing information is a limitation: 13.9% of sampled community cases lacked data for all four conditions and were included in the “none” category for the distribution in the report. Missingness for individual variables ranged as high as 19.4%. Survey weighting and statistical methods were used to account for the study design. The findings describe associations, not causation, individual disease prevalence, care quality or future health outcomes.

Sources

About Women’s Health & Diet: Women’s Health & Diet publishes evidence-informed nutrition, fitness and wellness information for women and families, translating public health research into accessible context for everyday decisions.

New CDC Data: Protein Accounts for 15.3% of Calories Among U.S. Women

New federal nutrition estimates show a modest sex difference in protein’s share of daily calories, while a decade-long trend points downward for U.S. adults overall.

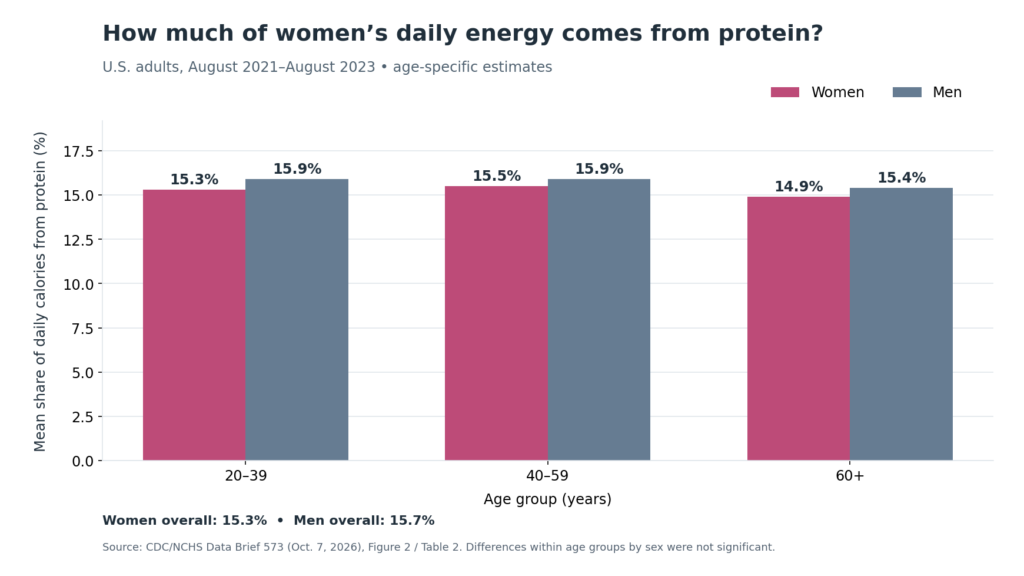
Women in the United States obtained an average of 15.3% of their daily calories from protein, compared with 15.7% among men, according to a CDC National Center for Health Statistics (NCHS) report released October 7, 2026. The report analyzes dietary recalls collected from August 2021 through August 2023 and provides a new national benchmark for conversations about protein, aging and everyday eating habits.

The same report finds that protein’s share of calories among all adults was 15.5% in the latest survey period, down from 16.1% in 2013–2014. That change describes the percentage of calories from protein—not necessarily a decline in grams of protein eaten, and not proof that Americans are deficient in protein.

Key Findings
  • Women: Protein accounted for 15.3% of daily calories, versus 15.7% for men; the overall difference was statistically significant in the CDC analysis.
  • Across women’s age groups: The estimates were 15.3% at ages 20–39, 15.5% at ages 40–59 and 14.9% at ages 60 and older; NCHS did not find significant differences by age within women.
  • All adults: Protein represented 15.5% of calories in August 2021–August 2023, compared with 16.1% in 2013–2014, with a significant decreasing linear trend across survey periods.
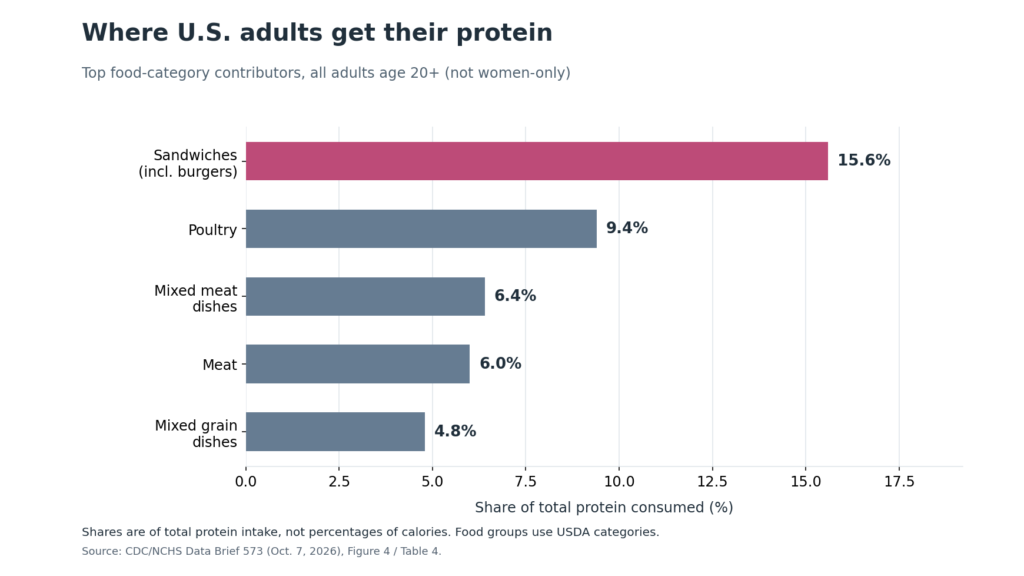
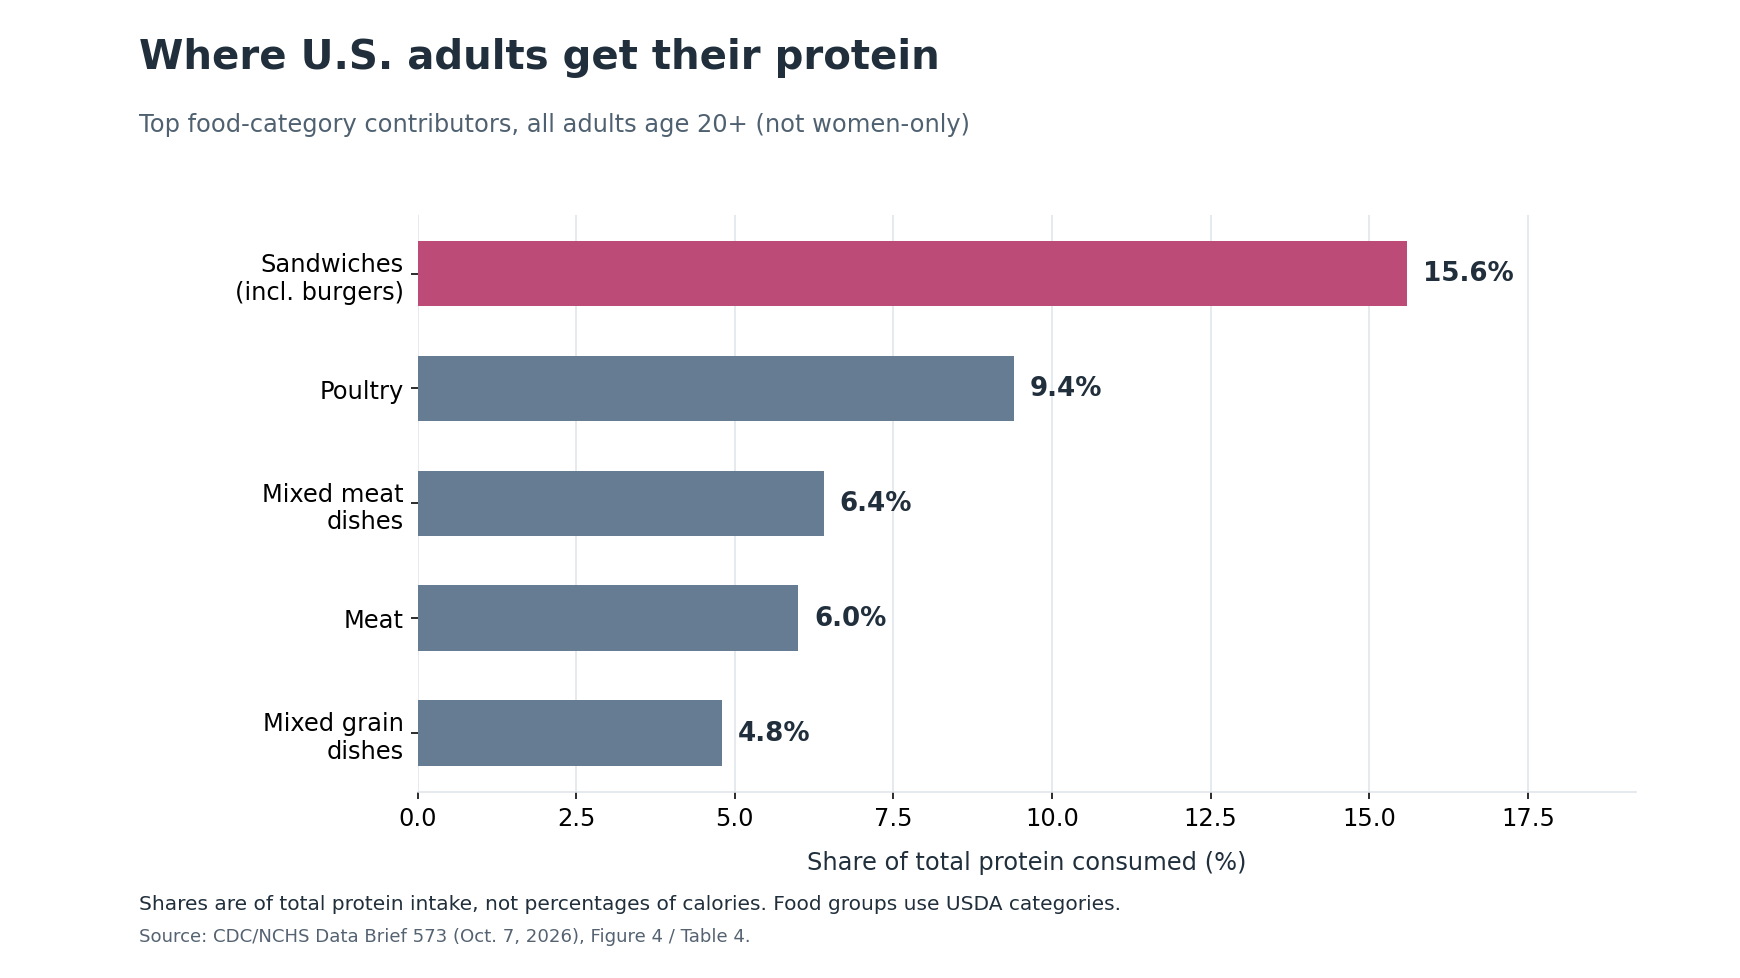
  • Food sources: Sandwiches (including burgers) contributed 15.6% of total protein among all adults, followed by poultry at 9.4%.
  • Interpretation: The figures do not show whether any individual woman is meeting her personal protein needs.

Source: CDC/NCHS, Data Brief No. 573, October 7, 2026, Figure 2 and Table 2; NHANES August 2021–August 2023. Values represent mean percentage of calories from protein, not grams consumed.

What the new figures say about women’s protein consumption

For women ages 20–39, protein made up 15.3% of daily calories on average; the corresponding figure was 15.5% at ages 40–59 and 14.9% at age 60 and older. Although those estimates differ numerically, the report did not find statistically significant age differences within women. Men had a slightly higher estimate overall, but differences between men and women within each age group were not statistically significant.

These percentages are useful for understanding the makeup of the population’s diet. They are not equivalent to daily protein targets, which are typically expressed in grams and depend on factors such as body size, life stage and health circumstances. The report does not determine whether women eat too little or too much protein.

Protein’s share of calories has declined across survey periods

Among U.S. adults overall, the average percentage of calories from protein was 16.1% in 2013–2014, 16.0% in 2015–2016, 15.5% in 2017–March 2020 and 15.5% in August 2021–August 2023. NCHS identified a statistically significant decreasing linear trend across these periods. The latest survey period is the most recent data in this report; it is not a measurement of what people ate in 2026.

Because the measure is a share of calories, a change could reflect changes in protein intake, calories from other macronutrients, total energy intake or some combination. The survey also changed its dietary-recall interview mode in the latest cycle, a methodological consideration when comparing years.

Sandwiches and poultry lead protein sources among adults

Looking at the food categories contributing to protein intake among all adults (not women specifically), NCHS ranked sandwiches first at 15.6% of total protein, followed by poultry (9.4%), mixed meat dishes (6.4%), meat (6.0%) and mixed grain dishes (4.8%). In this classification, sandwiches include burgers as well as several other types of sandwiches. The ranking measures where protein came from; it does not rank foods by healthfulness or establish which choices are best for an individual.

What readers can take away without overinterpreting the numbers

For women planning meals around work, exercise or family routines, the practical question is less about matching a national percentage and more about choosing a variety of protein-containing foods that fit personal needs and preferences. Eggs, seafood, poultry, beans, lentils, soy foods, dairy foods, nuts and seeds can all contribute. Food choices also affect fiber, sodium, saturated fat and other nutrients, so protein alone does not describe overall diet quality.

Women with questions about their individual needs—particularly during pregnancy, lactation, older age, athletic training or medical treatment—may benefit from advice tailored to their circumstances. For readers seeking help organizing food choices and fitness routines, Women’s Health & Diet offers a Custom Diet & Fitness Plan built around individual preferences and schedules.

Want a Plan Built Around Your Goals?

Get a personalized Women’s Health & Diet plan designed around your goals, schedule, food preferences, and fitness level.

Learn About Custom Diet & Fitness Plans

About the Data

This analysis summarizes NCHS Data Brief No. 573, published October 7, 2026, using the National Health and Nutrition Examination Survey (NHANES). The latest adult estimates cover 4,735 participants age 20 and older with reliable Day 1 dietary recalls: 2,622 females and 2,113 males. Pregnant and lactating women were excluded. The survey uses sample weights to support national estimates for the U.S. civilian, noninstitutionalized population.

The analysis reports mean protein as a share of total daily calories and, separately, the percentage of total protein supplied by USDA food categories. These are different denominators. The source data come from 24-hour dietary recall, which is subject to reporting error and does not establish each individual’s usual intake. The newest cycle collected recalls by telephone, while earlier cycles used an in-person first interview; this mode change should be considered when interpreting trends. The report is descriptive, not a causal study, and does not assess individual protein adequacy or prove health outcomes from any particular food category. Percentages are rounded as published by NCHS.

Sources

About Women’s Health & Diet: Women’s Health & Diet publishes practical nutrition, fitness and wellness information for women, including evidence-based explainers and analysis of public health data.

Severe Obesity Is Nearly Twice as Prevalent Among U.S. Women as Men, CDC Data Show

New federal data show a striking sex difference in severe obesity among U.S. adults, even as overall obesity prevalence was similar for women and men.

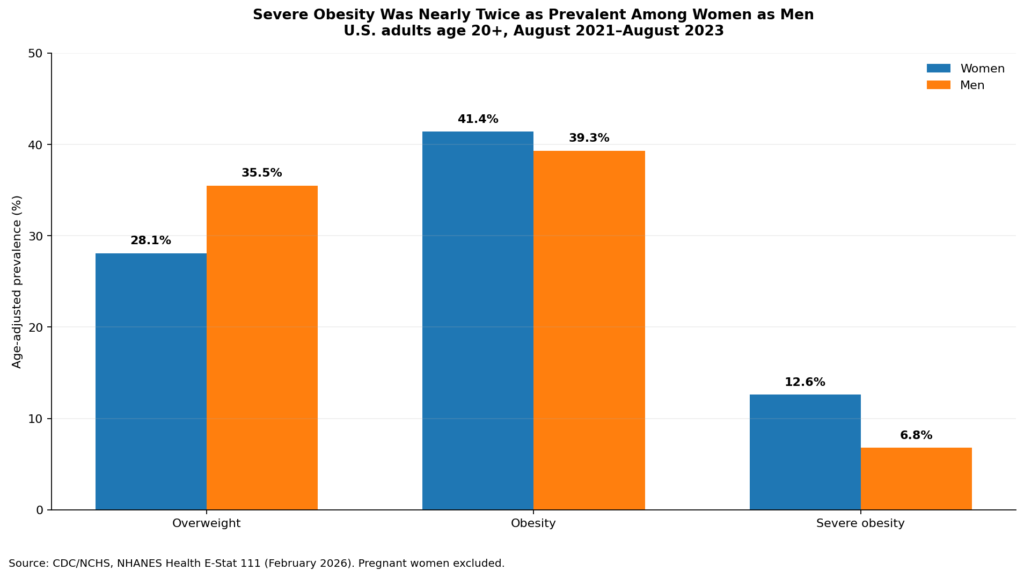
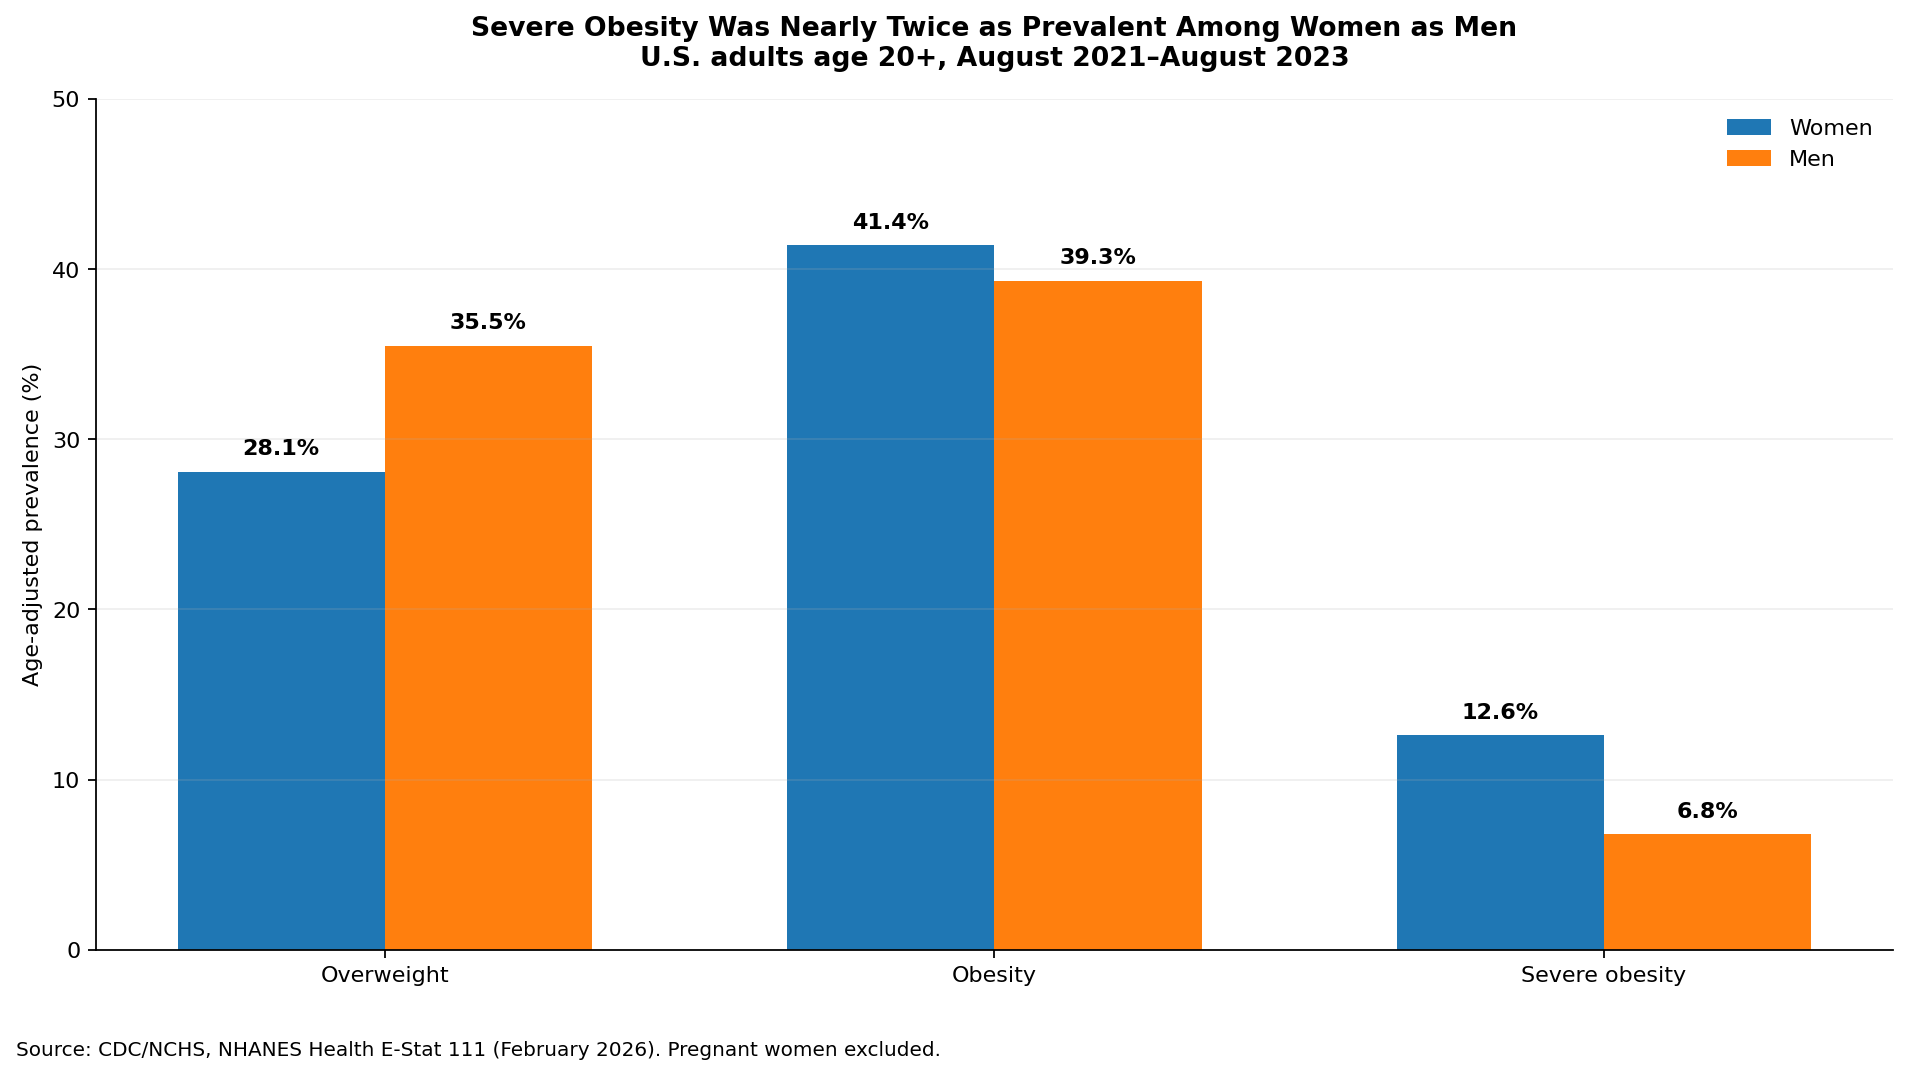
CDC’s National Center for Health Statistics reported that, during August 2021-August 2023, age-adjusted severe obesity prevalence was 12.6% among women and 6.8% among men age 20 and older. The estimates are based on measured height and weight from the National Health and Nutrition Examination Survey.

The findings provide a current national benchmark for journalists and health organizations tracking weight-related population trends. They describe prevalence at the population level and do not establish why the difference exists or determine any individual’s health.

Key Findings
  • Severe obesity prevalence was 12.6% among women versus 6.8% among men.
  • Overall obesity prevalence was 41.4% among women and 39.3% among men.
  • Overweight prevalence was 28.1% among women and 35.5% among men.
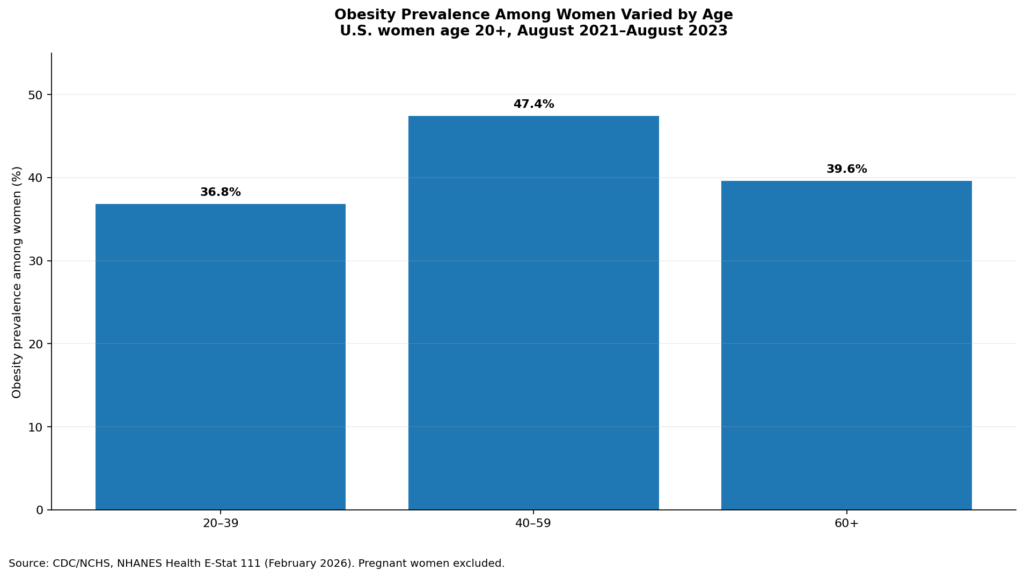
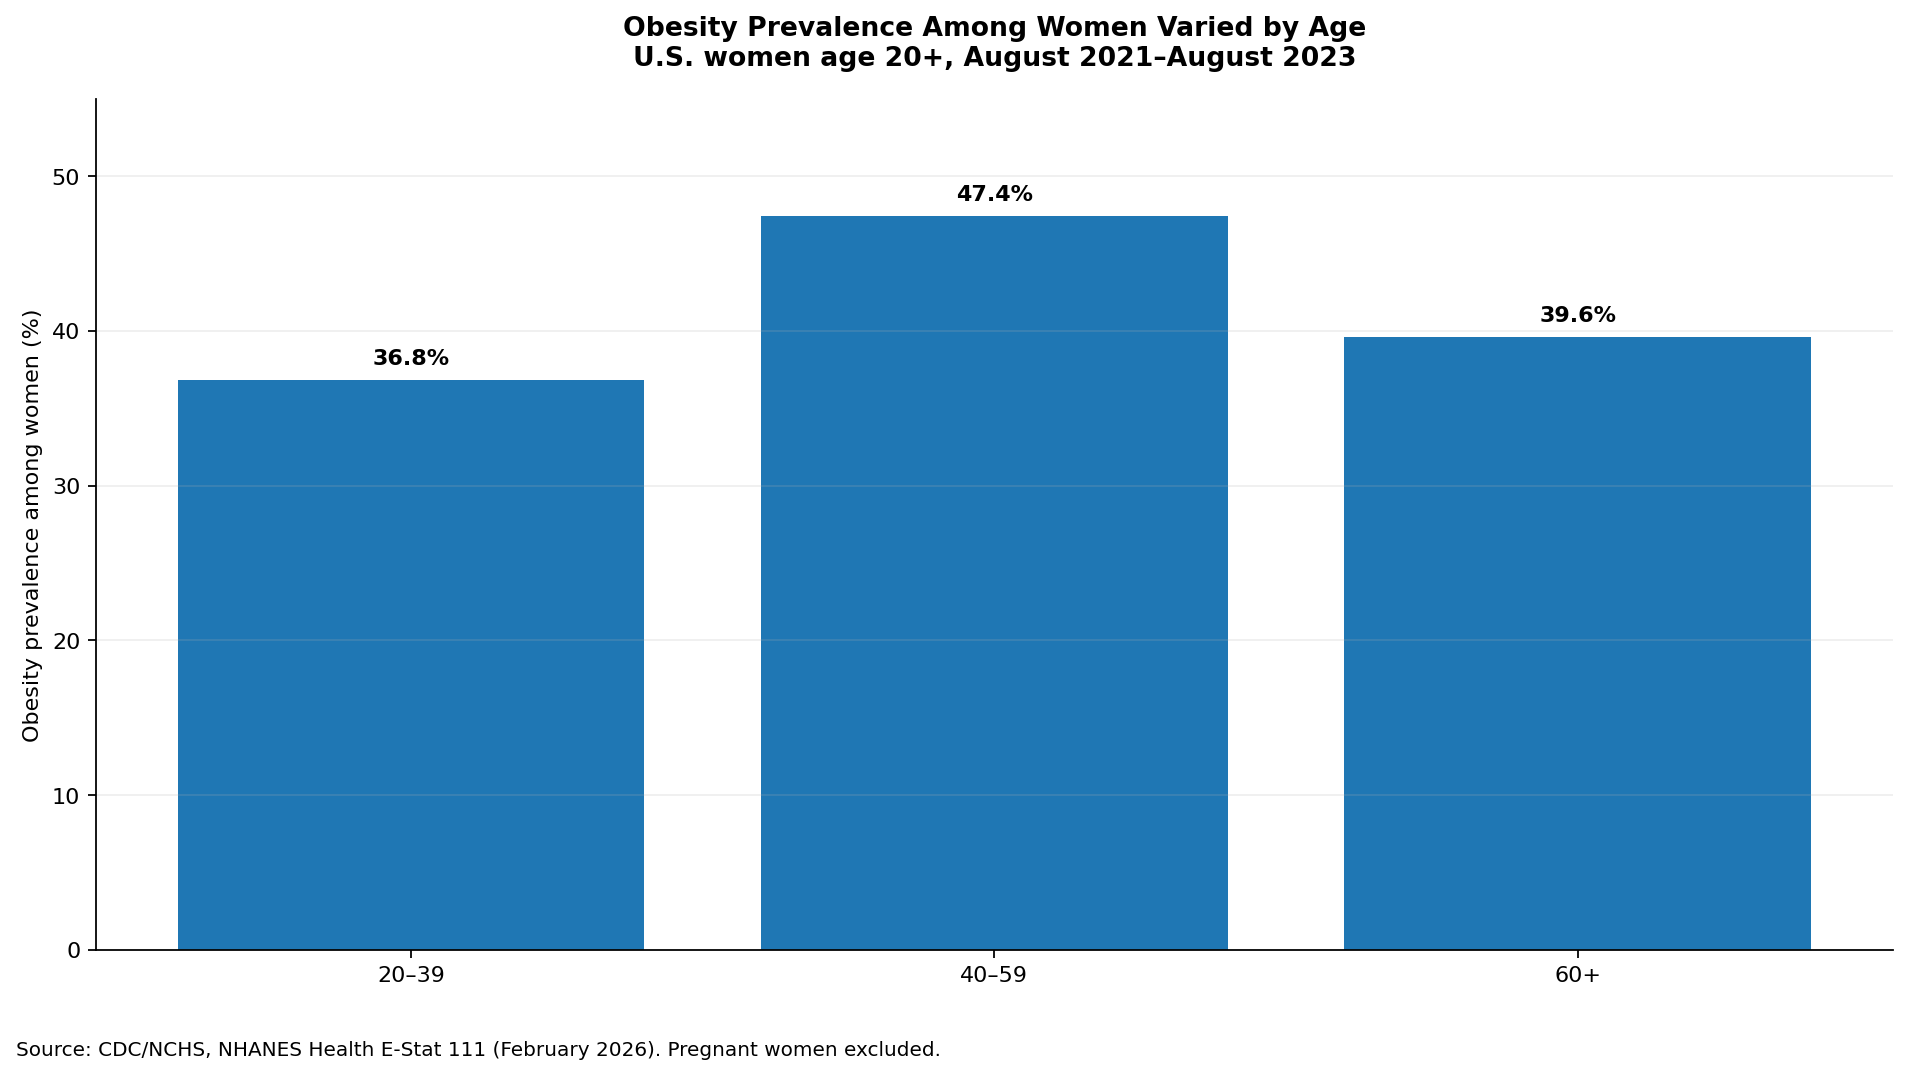
  • Among women, obesity prevalence was 36.8% at ages 20-39, 47.4% at ages 40-59, and 39.6% at age 60 and older.

Source: CDC/NCHS, National Health and Nutrition Examination Survey, August 2021-August 2023; Health E-Stat 111, February 2026.

The Largest Sex Gap Appeared in Severe Obesity

Overall obesity prevalence was broadly similar for women and men in the NCHS estimates, but severe obesity showed a substantially larger difference. The 12.6% prevalence among women was about 1.9 times the 6.8% prevalence among men. That comparison is descriptive and should not be interpreted as evidence that sex alone causes severe obesity.

Women’s Obesity Prevalence Varied by Age

Among women, obesity prevalence was highest in the 40-59 age group at 47.4%, compared with 36.8% among women ages 20-39 and 39.6% among women age 60 and older. These population estimates can help frame reporting on weight management and prevention, but they do not explain the biological, social, economic, behavioral or environmental factors that may contribute to the observed patterns.

Why Measured National Data Matter

NHANES uses standardized physical examinations rather than relying only on self-reported height and weight. That makes the survey an important source for nationally representative estimates of overweight and obesity. Body mass index is a population screening measure and does not by itself diagnose an individual’s health, body composition or disease risk.

Want a Plan Built Around Your Goals?

Get a personalized Women’s Health & Diet plan designed around your goals, schedule, food preferences, and fitness level.

Learn About Custom Diet & Fitness Plans

About the Data

The estimates come from CDC/NCHS Health E-Stat 111, published in February 2026, using National Health and Nutrition Examination Survey data collected from August 2021 through August 2023. Adults age 20 and older were classified using body mass index calculated from measured height and weight; pregnant women were excluded. Estimates were age adjusted where reported to support population comparisons. The analysis describes prevalence in the U.S. civilian noninstitutionalized adult population. It does not establish causes for differences by sex or age, predict outcomes for individuals, or substitute for individualized medical assessment. BMI is a screening measure and has recognized limitations when applied to individuals.

Sources

About Women’s Health & Diet: Women’s Health & Diet publishes practical, evidence-informed nutrition, fitness and wellness content for women, including research-driven insights that make public health data easier to understand and use.

Nearly 3 in 4 U.S. Women Ate Fruit on a Given Day, New CDC Data Show

New federal nutrition data show a measurable sex gap in fruit consumption among U.S. adults, with women more likely than men to report eating fruit on a given day.

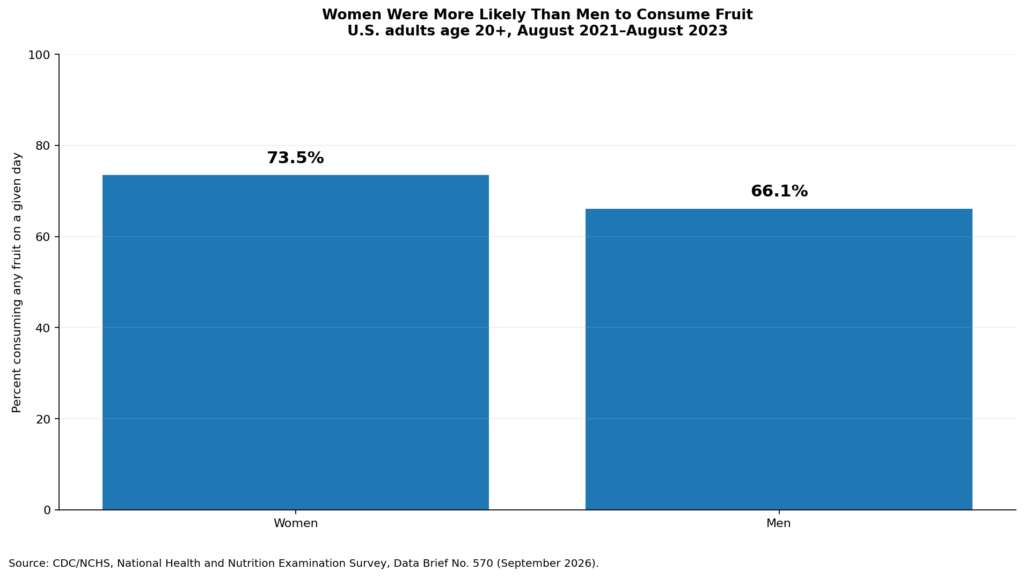
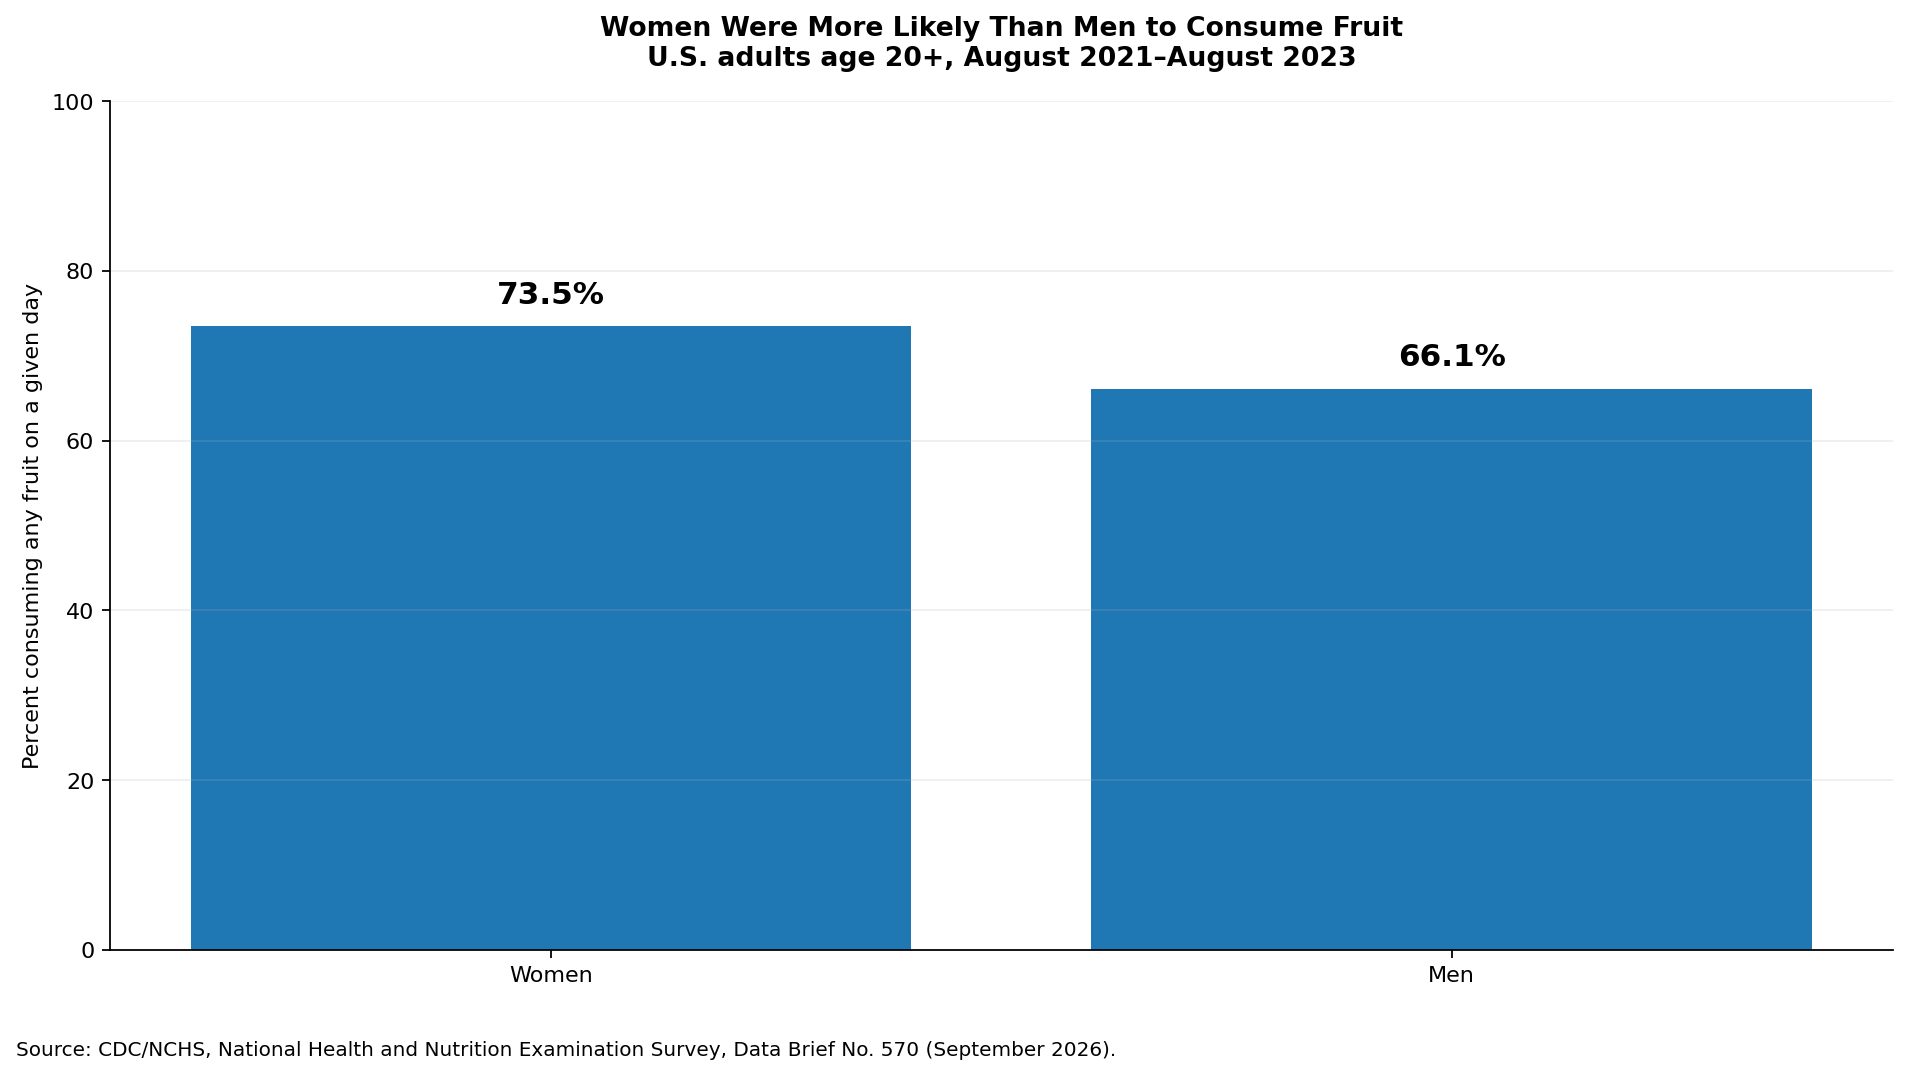
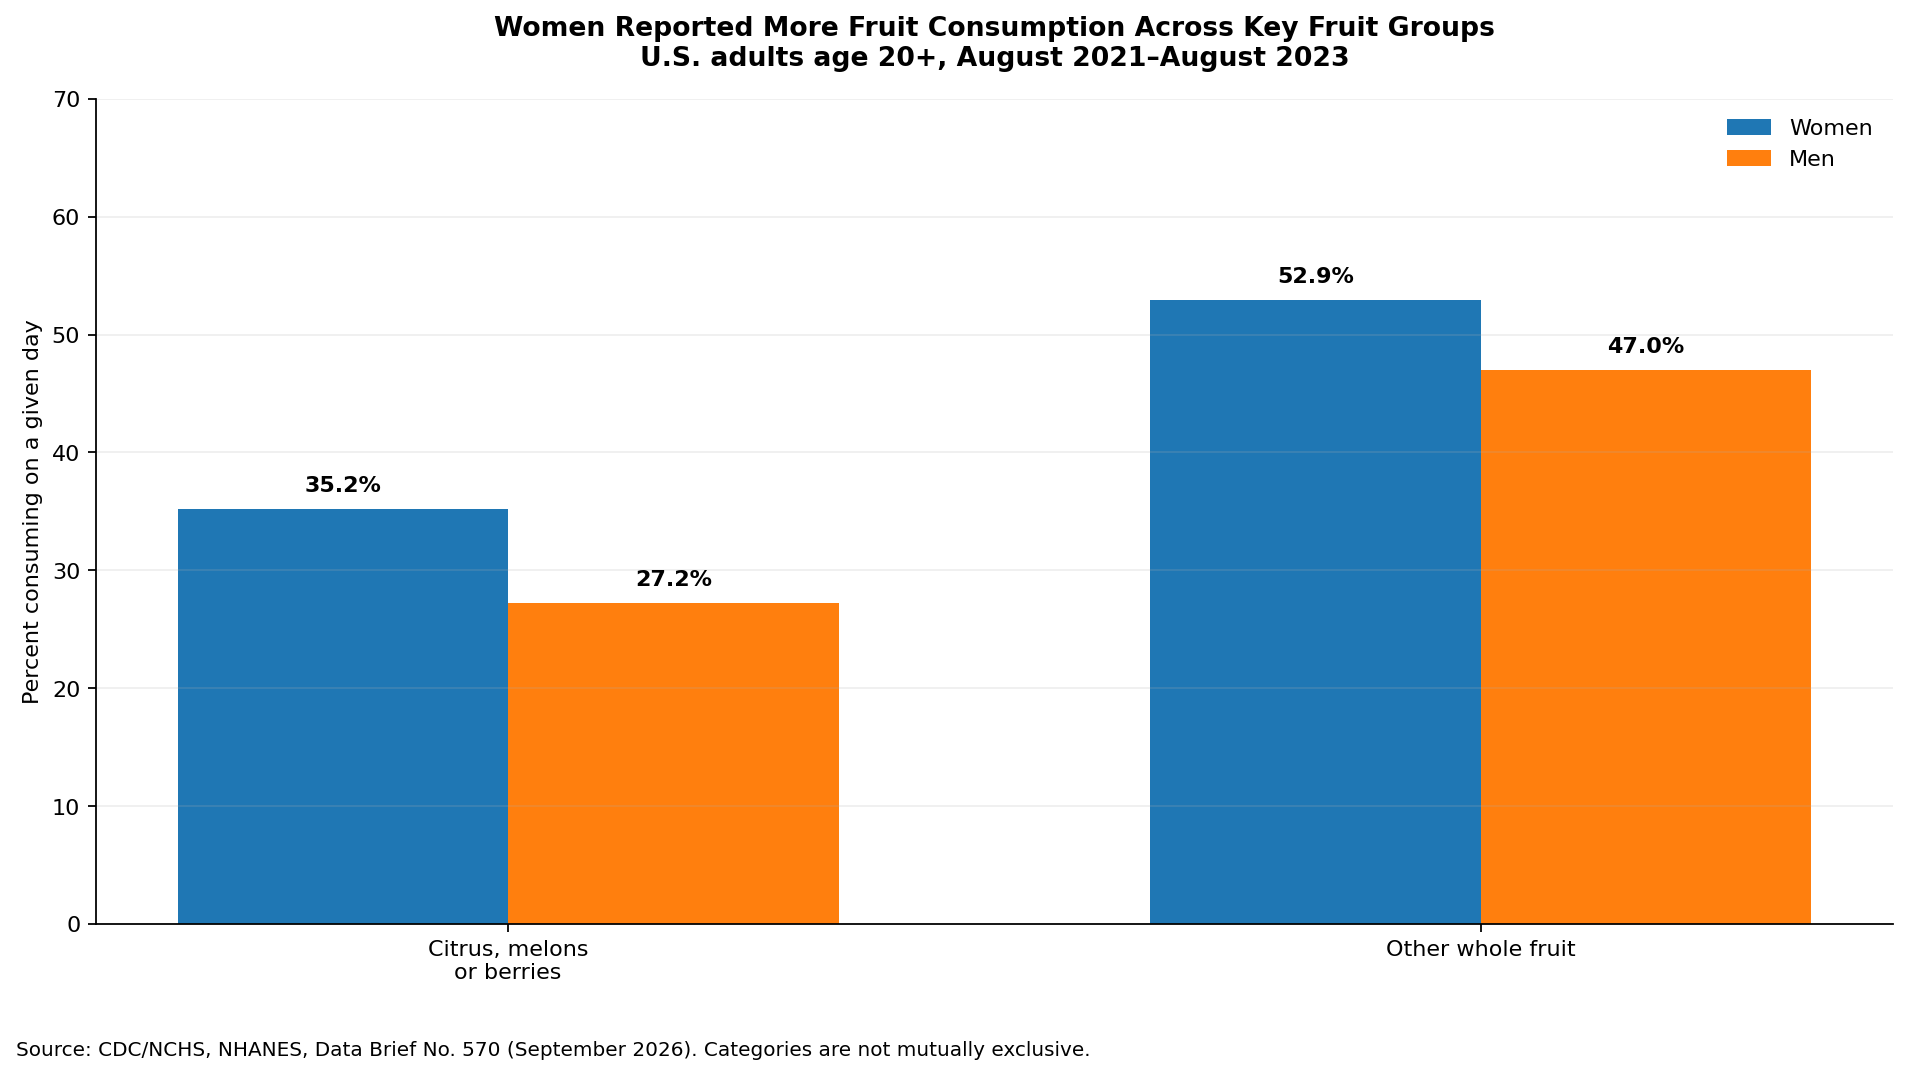
A September 2026 National Center for Health Statistics report using National Health and Nutrition Examination Survey data found that 73.5% of women age 20 and older consumed any fruit on a given day during August 2021-August 2023, compared with 66.1% of men. The report provides a timely snapshot of what Americans actually reported consuming rather than a measure of whether individuals met recommended intake amounts.

The difference also appeared in several whole-fruit categories, making the new release useful for journalists, nutrition professionals and wellness organizations tracking dietary patterns.

Key Findings
  • 73.5% of women consumed any fruit on a given day, compared with 66.1% of men.
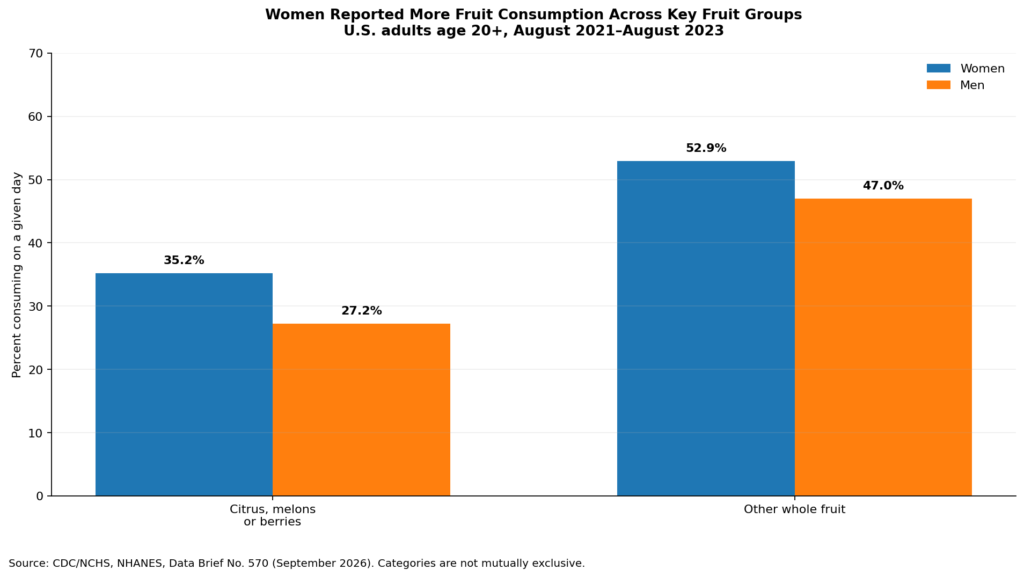
  • 35.2% of women consumed citrus, melons or berries, versus 27.2% of men.
  • 52.9% of women consumed other whole fruit, compared with 47.0% of men.
  • There was no statistically significant sex difference in consumption of 100% fruit juice.
  • Across all adults age 20 and older, 69.9% consumed any fruit on a given day.

Source: National Center for Health Statistics, National Health and Nutrition Examination Survey, August 2021-August 2023; NCHS Data Brief No. 570, September 2026.

The Fruit Gap Was Larger for Some Whole-Fruit Categories

The overall difference between women and men was 7.4 percentage points. The CDC report also found higher percentages among women for citrus, melons or berries and for other whole fruit. These results describe population-level consumption on a given day and should not be interpreted as showing that every woman eats more fruit than every man.

Fruit Juice Did Not Show the Same Significant Difference

For 100% fruit juice, the estimates were 32.8% for women and 29.0% for men, but the report found no statistically significant difference by sex. That distinction matters: numerical differences in survey estimates are not automatically evidence of a reliable population difference.

Income Was Also Linked With Fruit and Vegetable Consumption

NCHS reported that the percentage of adults consuming any fruit, citrus, melons or berries, and other whole fruit increased with family income. Several vegetable categories showed a similar income pattern. The report is descriptive, so it does not establish why those differences exist or prove that income itself caused them.

What the New Numbers Mean for Practical Wellness

The findings offer a current benchmark for dietary behavior in U.S. adults. They can help frame discussions about access, food habits and nutrition outreach, but they are not a diagnosis or an individual dietary prescription. A one-day dietary recall is best understood as a tool for estimating population patterns rather than judging any one person’s usual diet.

Want a Plan Built Around Your Goals?

Get a personalized Women’s Health & Diet plan designed around your goals, schedule, food preferences, and fitness level.

Learn About Custom Diet & Fitness Plans

About the Data

The figures come from NCHS Data Brief No. 570, published in September 2026, using data from the National Health and Nutrition Examination Survey collected during August 2021-August 2023. The fruit analysis included 4,798 adults age 20 and older: 2,115 men and 2,683 women. NHANES dietary information in this report was based on a 24-hour dietary recall, and estimates were weighted to represent the U.S. civilian noninstitutionalized population. The analysis describes the percentage who consumed specified fruit and vegetable categories on a given day. It does not measure whether each participant met recommended daily intake, establish usual intake for an individual, or prove causes for differences by sex or income.

Sources

About Women’s Health & Diet: Women’s Health & Diet publishes practical, evidence-informed nutrition, fitness and wellness content for women, including research-driven insights designed to make public health data easier to understand and use.

Nearly Half of U.S. Women Ages 18–44 Miss Both Major Exercise Targets

New CDC data suggest most U.S. women ages 18–44 are not meeting both major federal exercise recommendations, with muscle-strengthening activity standing out as a particularly large gap.

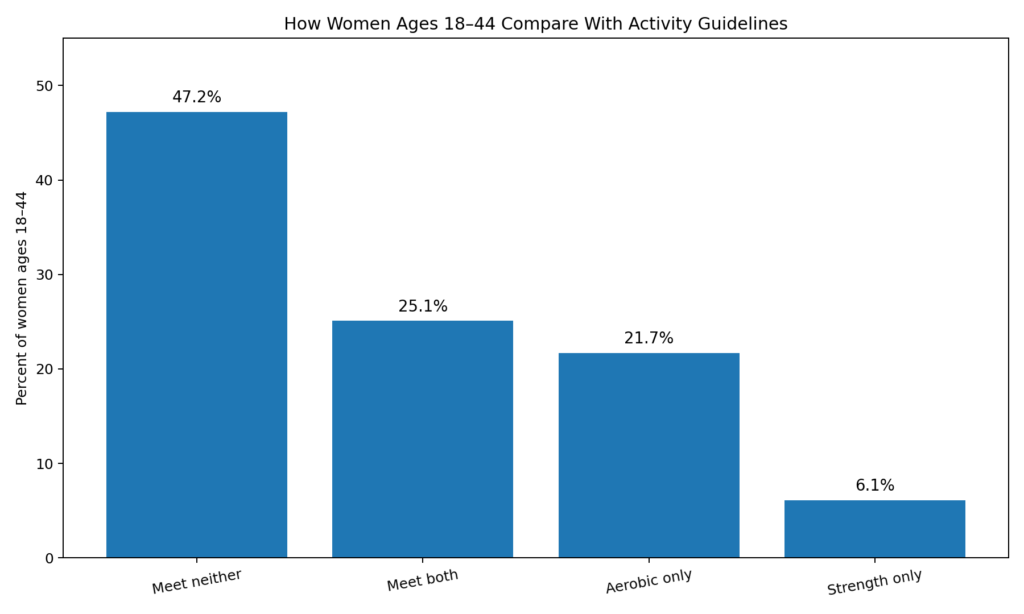
Nearly half of U.S. women ages 18–44 reported leisure-time physical activity that met neither the aerobic nor the muscle-strengthening recommendation, according to a CDC analysis of National Health Interview Survey data from 2022 and 2024.

Only about one in four women in this age group reported meeting both recommendations. The findings do not mean women must spend hours in a gym, but they do highlight an opportunity to make strength work a more visible part of everyday fitness conversations.

Key Findings

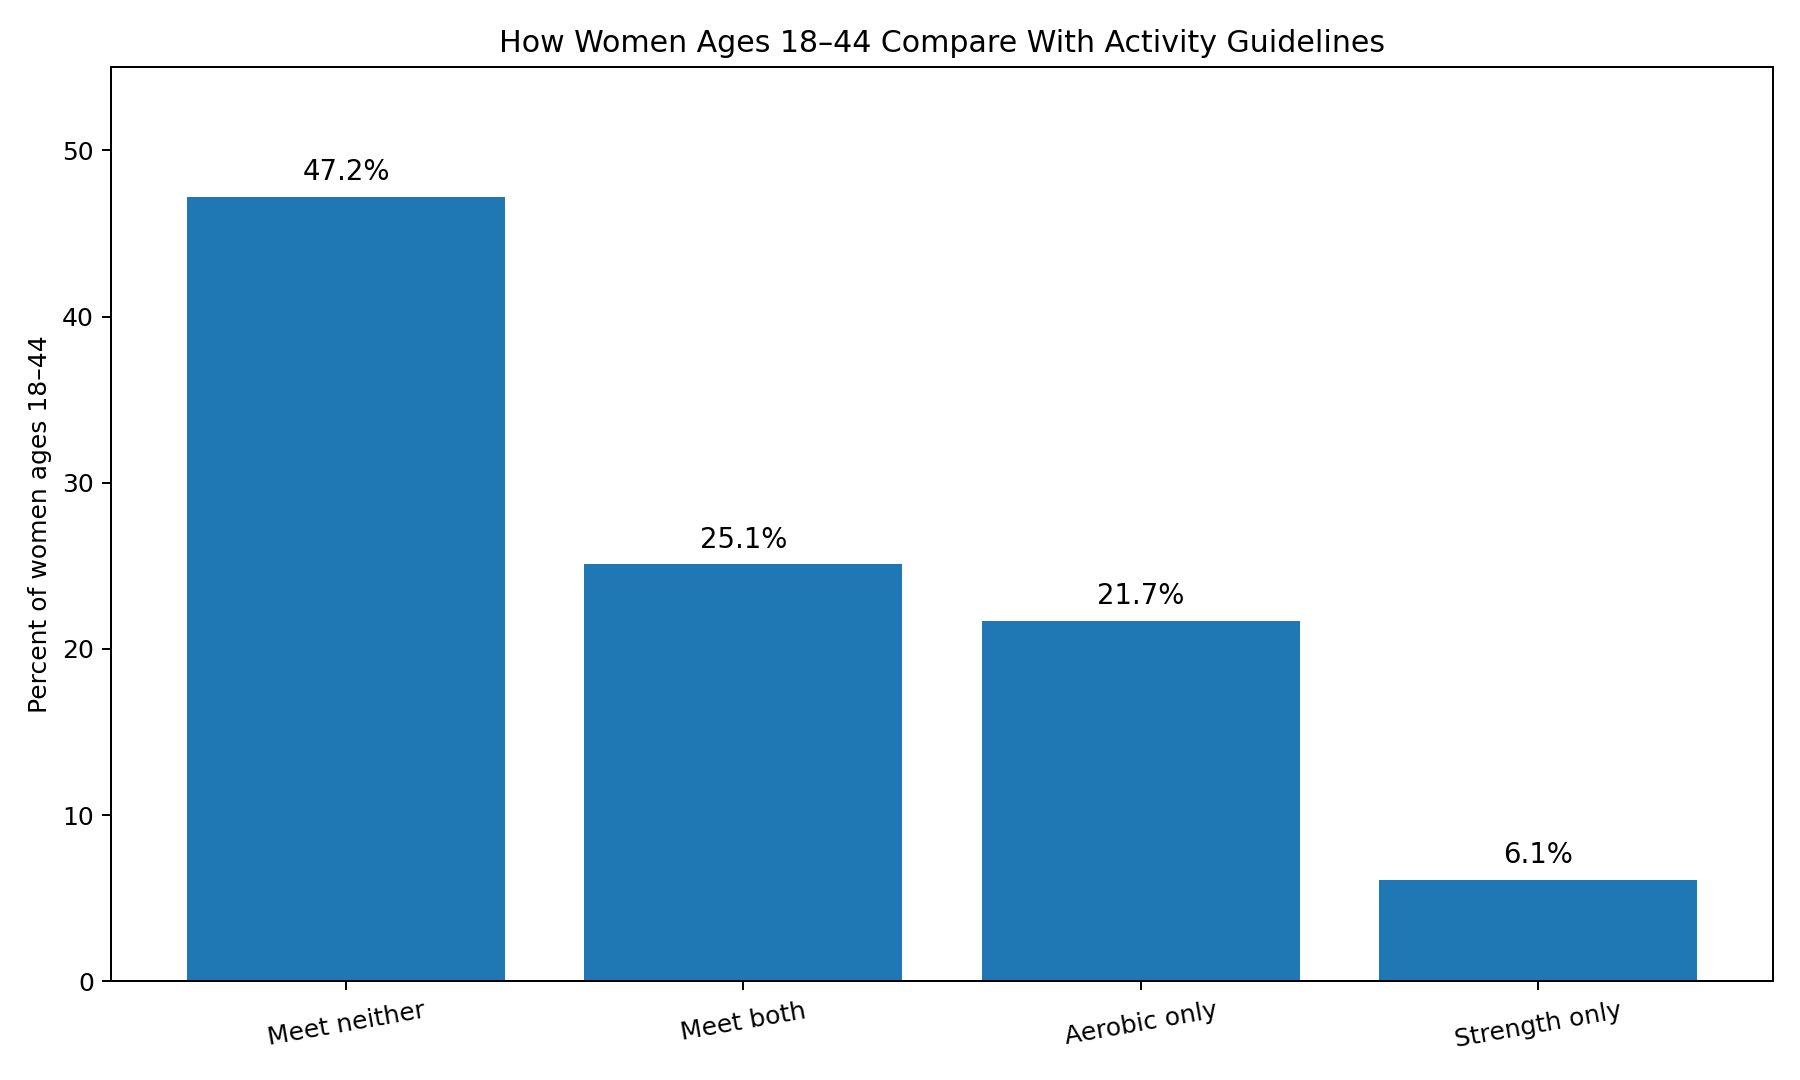
  • 47.2% met neither the aerobic nor the muscle-strengthening recommendation.
  • 25.1% met both recommendations.
  • 21.7% met the aerobic recommendation only.
  • 6.1% met the muscle-strengthening recommendation only.
  • 55.3% reported no muscle-strengthening activity.

Source: CDC MMWR analysis of the 2022 and 2024 National Health Interview Survey.

Why This Matters

Federal physical activity guidance for adults calls for at least 150 to 300 minutes of moderate-intensity aerobic activity each week, or the vigorous-intensity equivalent, plus muscle-strengthening activity on at least two days a week. The CDC report found that many women are reaching only part of that mix, or neither part at all.

Aerobic activity and muscle-strengthening activity support different but complementary aspects of health. Strength-focused exercise can contribute to muscle and bone health and can help preserve lean mass during weight loss, while aerobic activity supports cardiovascular and metabolic health.

The Bigger Gap May Be Strength Training

The report found that 55.3% of women ages 18–44 reported no muscle-strengthening activity. By comparison, 23.2% reported no moderate-to-vigorous aerobic activity. That difference suggests strength training may be less accessible, less familiar, or simply less prioritized for many women.

What Women Can Do With This Information

For women who are currently inactive, the goal does not have to be an all-or-nothing jump to a perfect weekly routine. U.S. physical activity guidance emphasizes that some activity is better than none and that people can build toward the recommended amounts over time.

A practical starting point might be adding two brief strength sessions to an existing walking or cardio routine, using bodyweight movements, resistance bands, dumbbells, or machines. The best routine is one that fits a woman’s schedule, fitness level, access to equipment, and health needs.

Want a Plan Built Around Your Goals?

Get a personalized Women’s Health & Diet plan designed around your goals, schedule, food preferences, and fitness level.

Learn About Custom Diet & Fitness Plans

About the Data

This article is based on the CDC MMWR report Leisure-Time Physical Activity Among Women of Reproductive Age — United States, 2022 and 2024. Researchers combined the two most recent National Health Interview Survey years with physical activity data to improve the precision of national estimates.

After excluding respondents with missing activity or education data, the analytic sample included 10,891 women ages 18–44, weighted to represent approximately 56.1 million U.S. women in that age range. Activity was self-reported and measured leisure-time activity only, so the estimates do not capture every form of movement, including occupational activity. Self-reporting can also be affected by recall or social-desirability bias. The results describe population patterns and do not establish that any one activity pattern caused a particular health outcome.

Sources

About Women’s Health & Diet: Women’s Health & Diet publishes practical, evidence-informed content on women’s nutrition, fitness, weight management, and everyday wellness.