New CDC Data: Protein Accounts for 15.3% of Calories Among U.S. Women
New federal nutrition estimates show a modest sex difference in protein’s share of daily calories, while a decade-long trend points downward for U.S. adults overall.
Women in the United States obtained an average of 15.3% of their daily calories from protein, compared with 15.7% among men, according to a CDC National Center for Health Statistics (NCHS) report released October 7, 2026. The report analyzes dietary recalls collected from August 2021 through August 2023 and provides a new national benchmark for conversations about protein, aging and everyday eating habits.
The same report finds that protein’s share of calories among all adults was 15.5% in the latest survey period, down from 16.1% in 2013–2014. That change describes the percentage of calories from protein—not necessarily a decline in grams of protein eaten, and not proof that Americans are deficient in protein.
- Women: Protein accounted for 15.3% of daily calories, versus 15.7% for men; the overall difference was statistically significant in the CDC analysis.
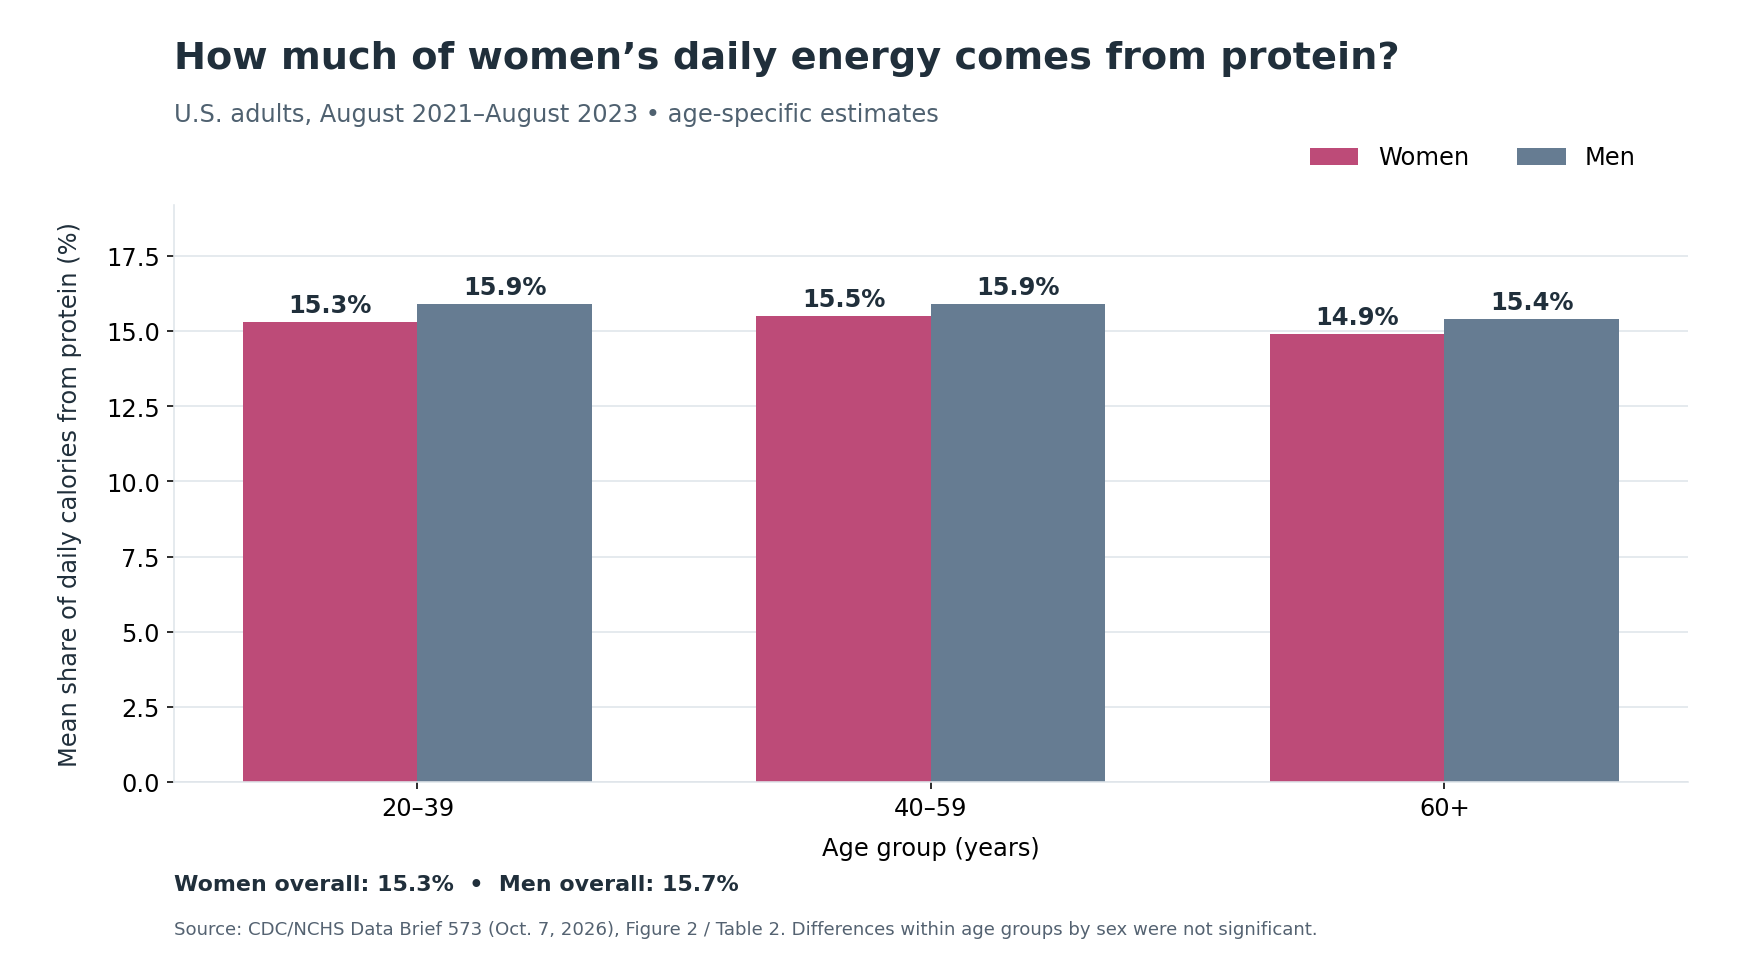
- Across women’s age groups: The estimates were 15.3% at ages 20–39, 15.5% at ages 40–59 and 14.9% at ages 60 and older; NCHS did not find significant differences by age within women.
- All adults: Protein represented 15.5% of calories in August 2021–August 2023, compared with 16.1% in 2013–2014, with a significant decreasing linear trend across survey periods.
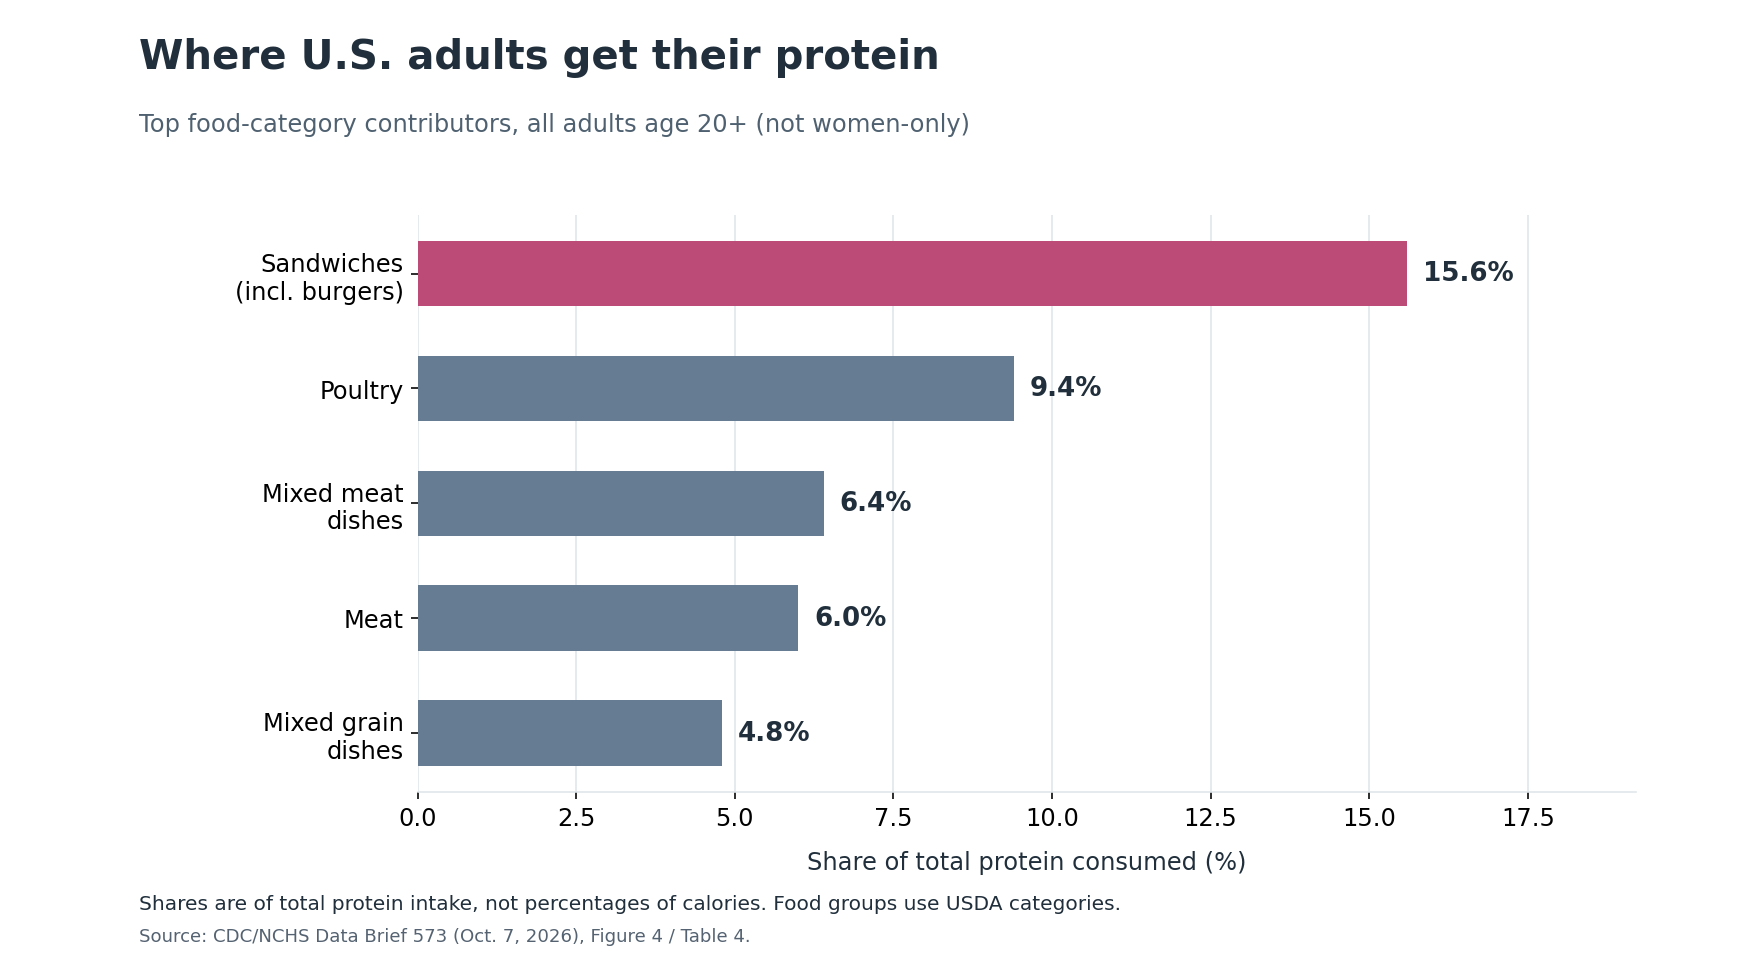
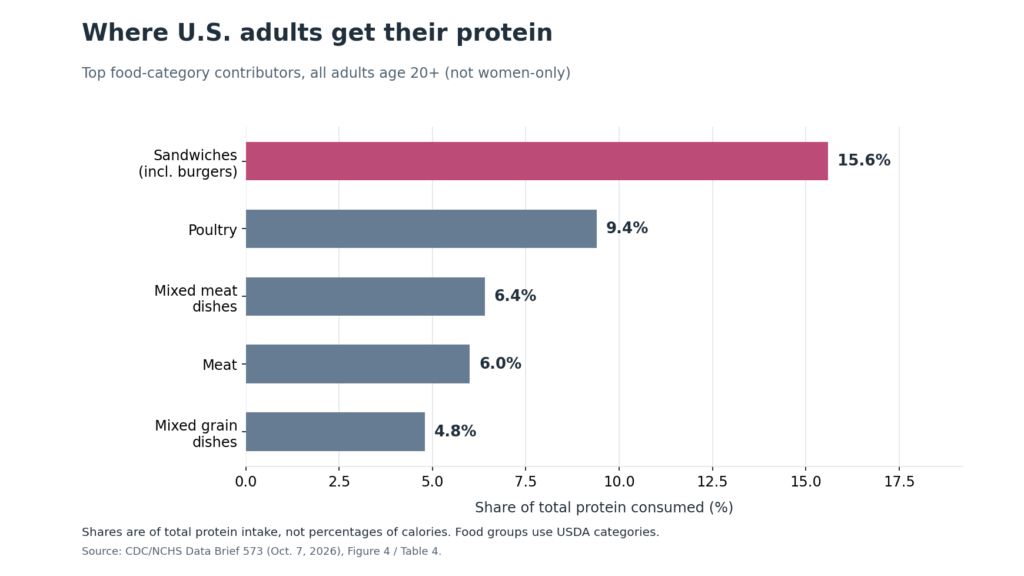
- Food sources: Sandwiches (including burgers) contributed 15.6% of total protein among all adults, followed by poultry at 9.4%.
- Interpretation: The figures do not show whether any individual woman is meeting her personal protein needs.
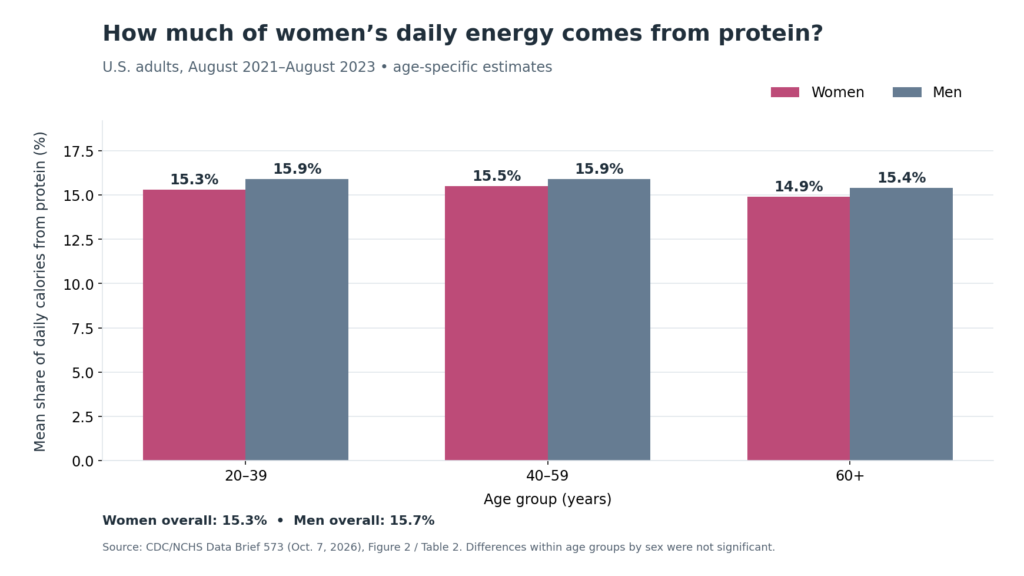
Source: CDC/NCHS, Data Brief No. 573, October 7, 2026, Figure 2 and Table 2; NHANES August 2021–August 2023. Values represent mean percentage of calories from protein, not grams consumed.
What the new figures say about women’s protein consumption
For women ages 20–39, protein made up 15.3% of daily calories on average; the corresponding figure was 15.5% at ages 40–59 and 14.9% at age 60 and older. Although those estimates differ numerically, the report did not find statistically significant age differences within women. Men had a slightly higher estimate overall, but differences between men and women within each age group were not statistically significant.
These percentages are useful for understanding the makeup of the population’s diet. They are not equivalent to daily protein targets, which are typically expressed in grams and depend on factors such as body size, life stage and health circumstances. The report does not determine whether women eat too little or too much protein.
Protein’s share of calories has declined across survey periods
Among U.S. adults overall, the average percentage of calories from protein was 16.1% in 2013–2014, 16.0% in 2015–2016, 15.5% in 2017–March 2020 and 15.5% in August 2021–August 2023. NCHS identified a statistically significant decreasing linear trend across these periods. The latest survey period is the most recent data in this report; it is not a measurement of what people ate in 2026.
Because the measure is a share of calories, a change could reflect changes in protein intake, calories from other macronutrients, total energy intake or some combination. The survey also changed its dietary-recall interview mode in the latest cycle, a methodological consideration when comparing years.
Sandwiches and poultry lead protein sources among adults
Looking at the food categories contributing to protein intake among all adults (not women specifically), NCHS ranked sandwiches first at 15.6% of total protein, followed by poultry (9.4%), mixed meat dishes (6.4%), meat (6.0%) and mixed grain dishes (4.8%). In this classification, sandwiches include burgers as well as several other types of sandwiches. The ranking measures where protein came from; it does not rank foods by healthfulness or establish which choices are best for an individual.
What readers can take away without overinterpreting the numbers
For women planning meals around work, exercise or family routines, the practical question is less about matching a national percentage and more about choosing a variety of protein-containing foods that fit personal needs and preferences. Eggs, seafood, poultry, beans, lentils, soy foods, dairy foods, nuts and seeds can all contribute. Food choices also affect fiber, sodium, saturated fat and other nutrients, so protein alone does not describe overall diet quality.
Women with questions about their individual needs—particularly during pregnancy, lactation, older age, athletic training or medical treatment—may benefit from advice tailored to their circumstances. For readers seeking help organizing food choices and fitness routines, Women’s Health & Diet offers a Custom Diet & Fitness Plan built around individual preferences and schedules.
Get a personalized Women’s Health & Diet plan designed around your goals, schedule, food preferences, and fitness level.
About the Data
This analysis summarizes NCHS Data Brief No. 573, published October 7, 2026, using the National Health and Nutrition Examination Survey (NHANES). The latest adult estimates cover 4,735 participants age 20 and older with reliable Day 1 dietary recalls: 2,622 females and 2,113 males. Pregnant and lactating women were excluded. The survey uses sample weights to support national estimates for the U.S. civilian, noninstitutionalized population.
The analysis reports mean protein as a share of total daily calories and, separately, the percentage of total protein supplied by USDA food categories. These are different denominators. The source data come from 24-hour dietary recall, which is subject to reporting error and does not establish each individual’s usual intake. The newest cycle collected recalls by telephone, while earlier cycles used an in-person first interview; this mode change should be considered when interpreting trends. The report is descriptive, not a causal study, and does not assess individual protein adequacy or prove health outcomes from any particular food category. Percentages are rounded as published by NCHS.
Sources
- CDC/NCHS: Protein Consumption Among Youth and Adults: United States, August 2021–August 2023 (Data Brief No. 573, October 7, 2026).
- CDC/NCHS: National Health and Nutrition Examination Survey (NHANES) (survey background and methods).
- USDA Agricultural Research Service: What We Eat in America Food Categories (classification used in source analysis).
- CDC/NCHS: NHANES August 2021–August 2023 Dietary Recall Interview Mode Change (methodological background).
About Women’s Health & Diet: Women’s Health & Diet publishes practical nutrition, fitness and wellness information for women, including evidence-based explainers and analysis of public health data.